The cost of outdated documentation: how to estimate engineering time, support load and revenue risk
Estimate outdated documentation cost across engineering interruptions, support workload, remediation debt and revenue risk with a practical 30-day model.
- Written by
- Evan Shamoon (opens in a new tab)
- Published on
- Read time
- 17 min

Outdated documentation rarely appears as a line item. The cost turns up somewhere else: repeat support cases, engineers pulled away from planned work, emergency rewrites after a release, slower onboarding, or a buyer who cannot verify that the product fits.
A defensible estimate separates four numbers:
- Measured operating cost during a fixed period.
- The one-time effort required to repair known documentation debt.
- The forward workload required to stop new debt from accumulating.
- Revenue risk supported by an explicit, confidence-adjusted model.
Keep those numbers separate. A support hour is observed labor. An opportunity delayed by unclear documentation is exposure. They do not become the same kind of cost because a spreadsheet can add them.
Old documentation is not necessarily outdated
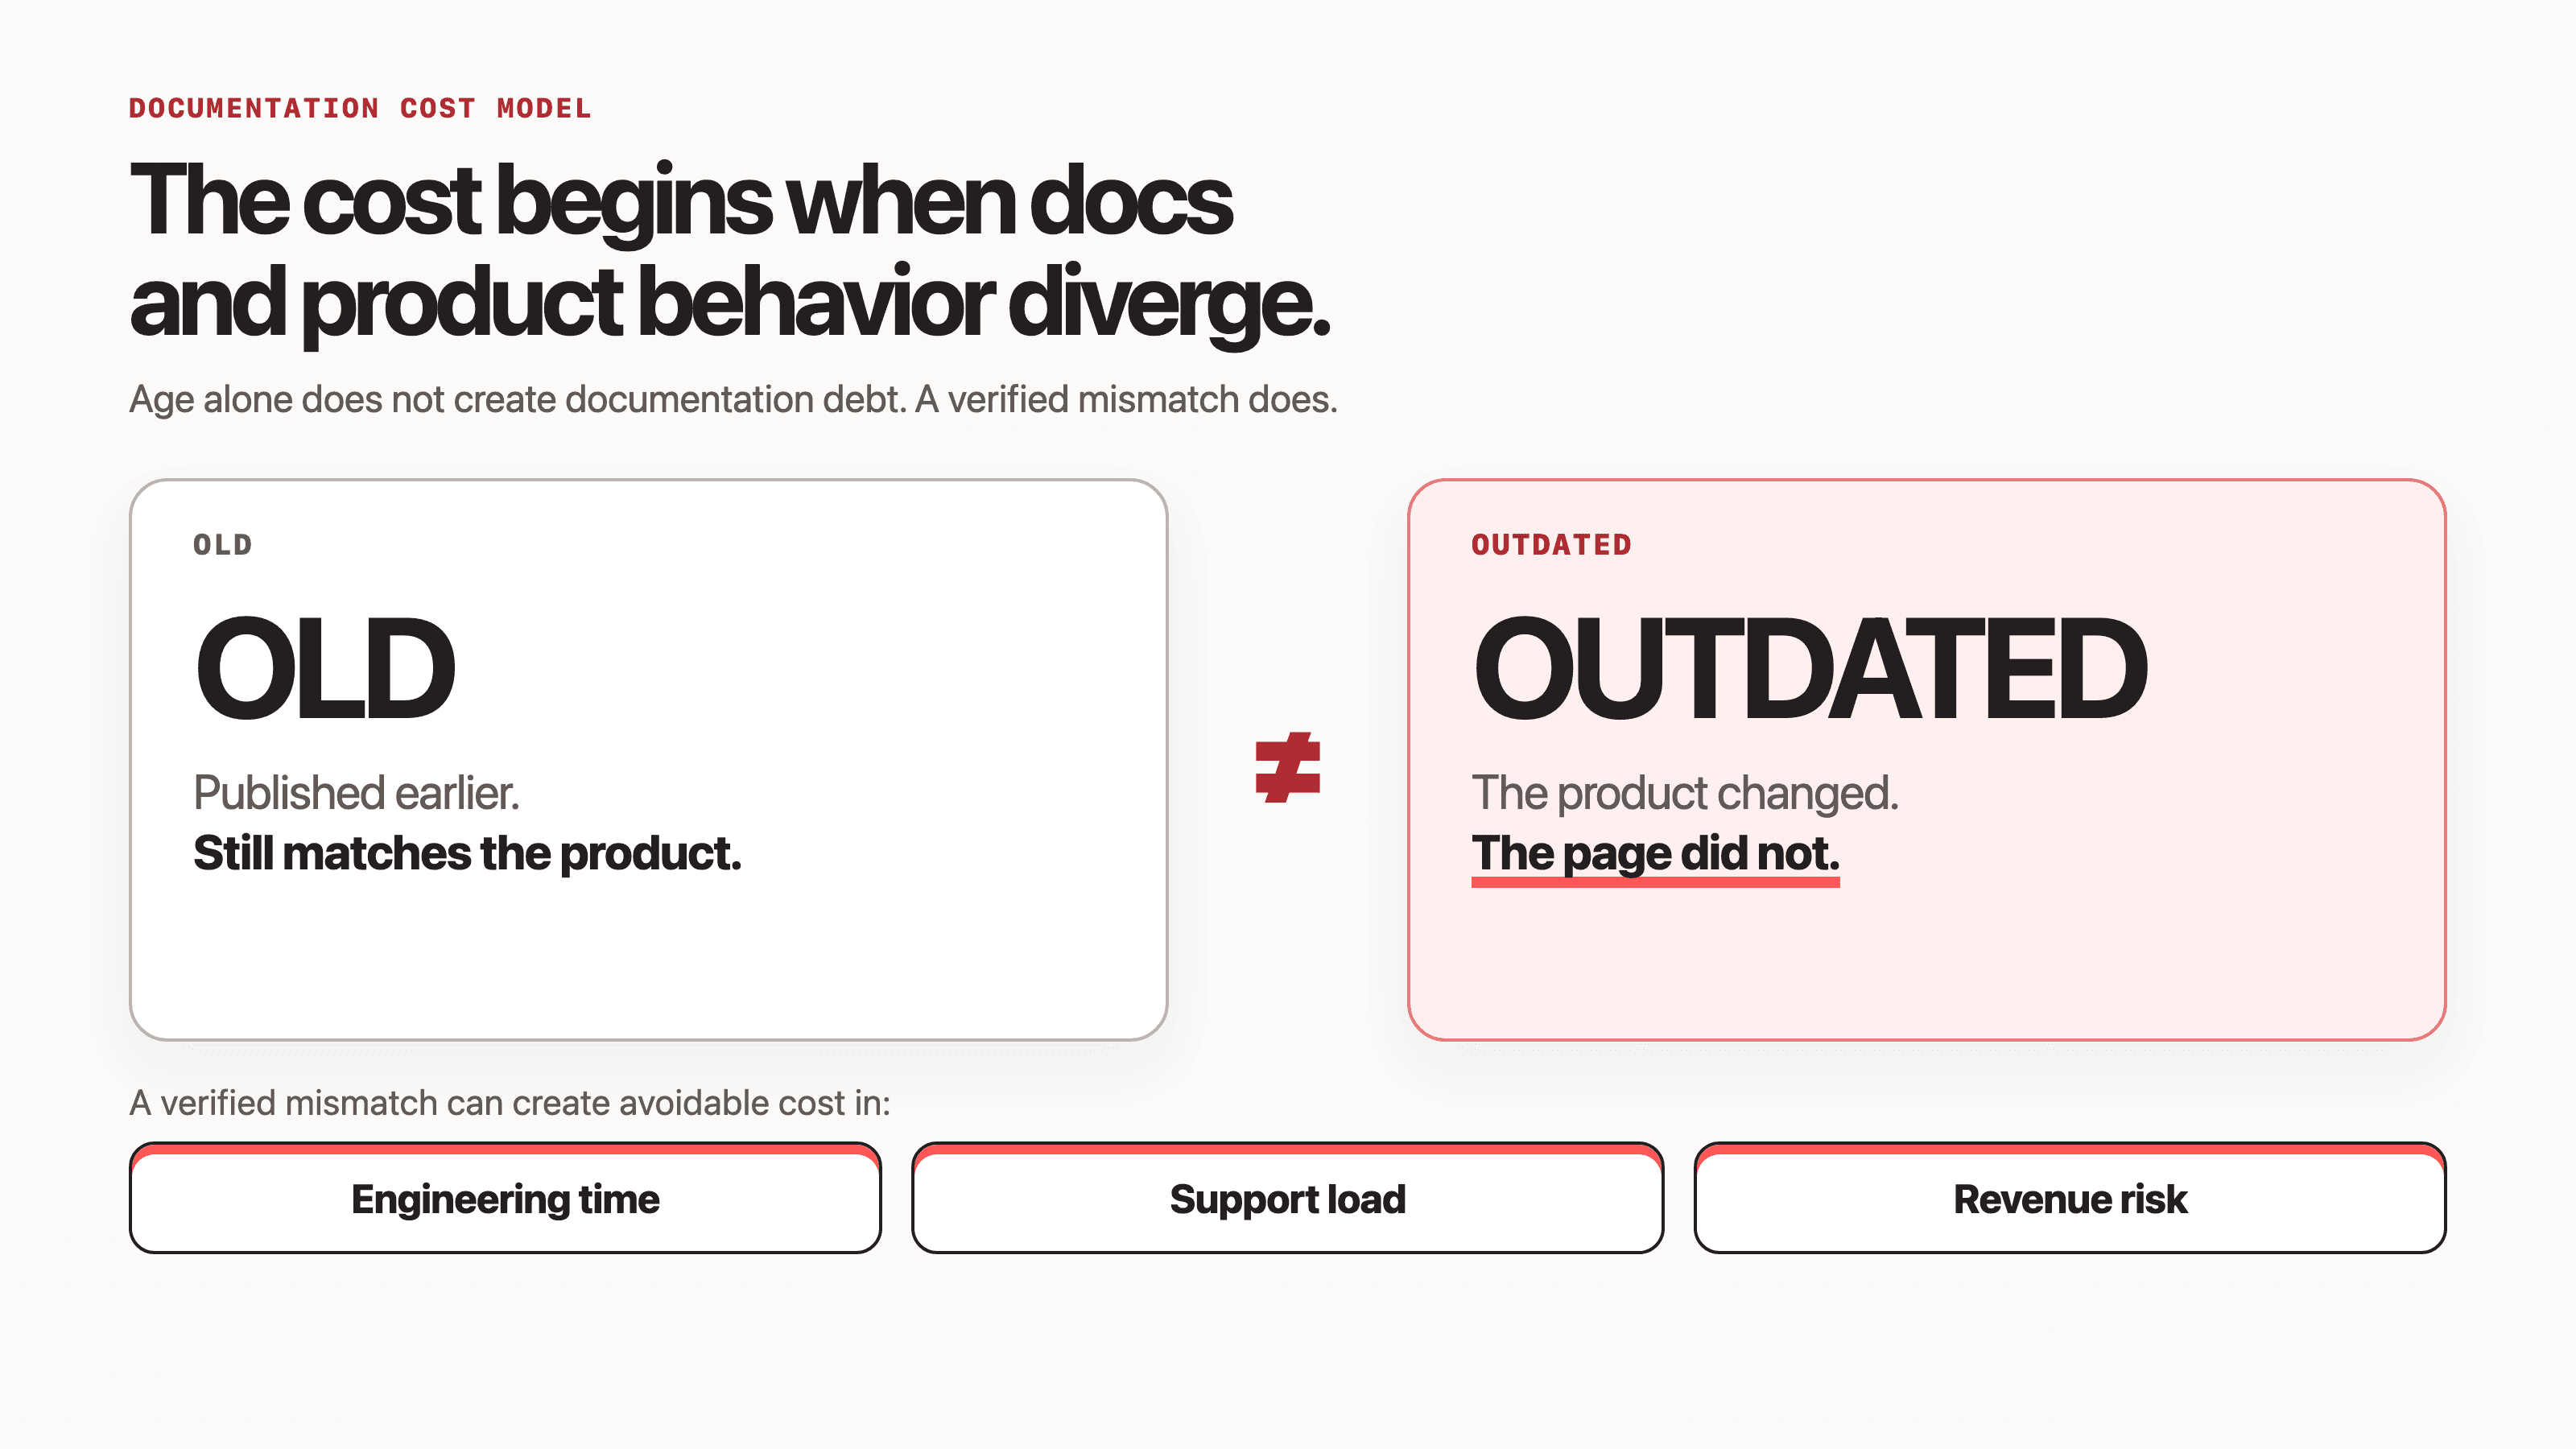
A page can be three years old and still describe a stable feature correctly. Another page can become wrong the afternoon after publication because an endpoint, authentication flow, configuration option, screenshot, or product limit changed.
Use this test:
Documentation is outdated when it no longer matches current product behavior or no longer helps the intended reader complete the documented task.
That definition keeps the business case tied to a mismatch, rather than page age or a vague freshness score.
Start with one bounded failure mode. Examples include:
- An authentication guide that describes the previous OAuth flow.
- An SDK example that uses a removed method.
- A setup guide with an old environment variable.
- A support answer that solved a recurring issue but never reached the public docs.
- An integration page that omits a compatibility constraint buyers keep asking about.
Choose one product area, one reader journey, and one measurement window. Thirty days is usually enough to establish a first baseline without turning the exercise into a company-wide data project.
The cost model at a glance
The model uses four outputs because each supports a different decision.
| Output | What it answers | Typical evidence |
|---|---|---|
| Observed operating burden | What did the mismatch consume this period? | Support handling time, engineering interruptions, workarounds |
| Documentation debt principal | What will it take to repair the known backlog? | Remaining drafting, validation, review and publishing effort |
| Forward maintenance workload | What capacity will keep new changes aligned? | Release volume, doc-impact rate, review effort |
| Modeled revenue risk | What business outcome may change if the mismatch persists? | Activation cohorts, buyer notes, security reviews, CRM evidence |
A useful executive summary looks like this:
Measured cost this period:                  $X to $Y
Outstanding remediation principal:          $A to $B
Required maintenance capacity next period:  C to D hours
Modeled revenue risk for the stated horizon: $E to $F
Do not publish a single total until every component uses the same time horizon, attribution rule, and value basis. In most early business cases, showing the four lines separately is more honest and more useful.
Attribute the incremental cost before doing the arithmetic
The easiest way to inflate the result is to assign the full cost of every related event to documentation.
A support case may have taken 40 minutes, but correct documentation might have saved only 15. A sales opportunity may mention weak docs, but product fit, price, timing, and procurement still affect the outcome. An engineer may spend an hour on a question, then use part of that hour to fix a real product bug.
Count the delta created by the documentation mismatch.
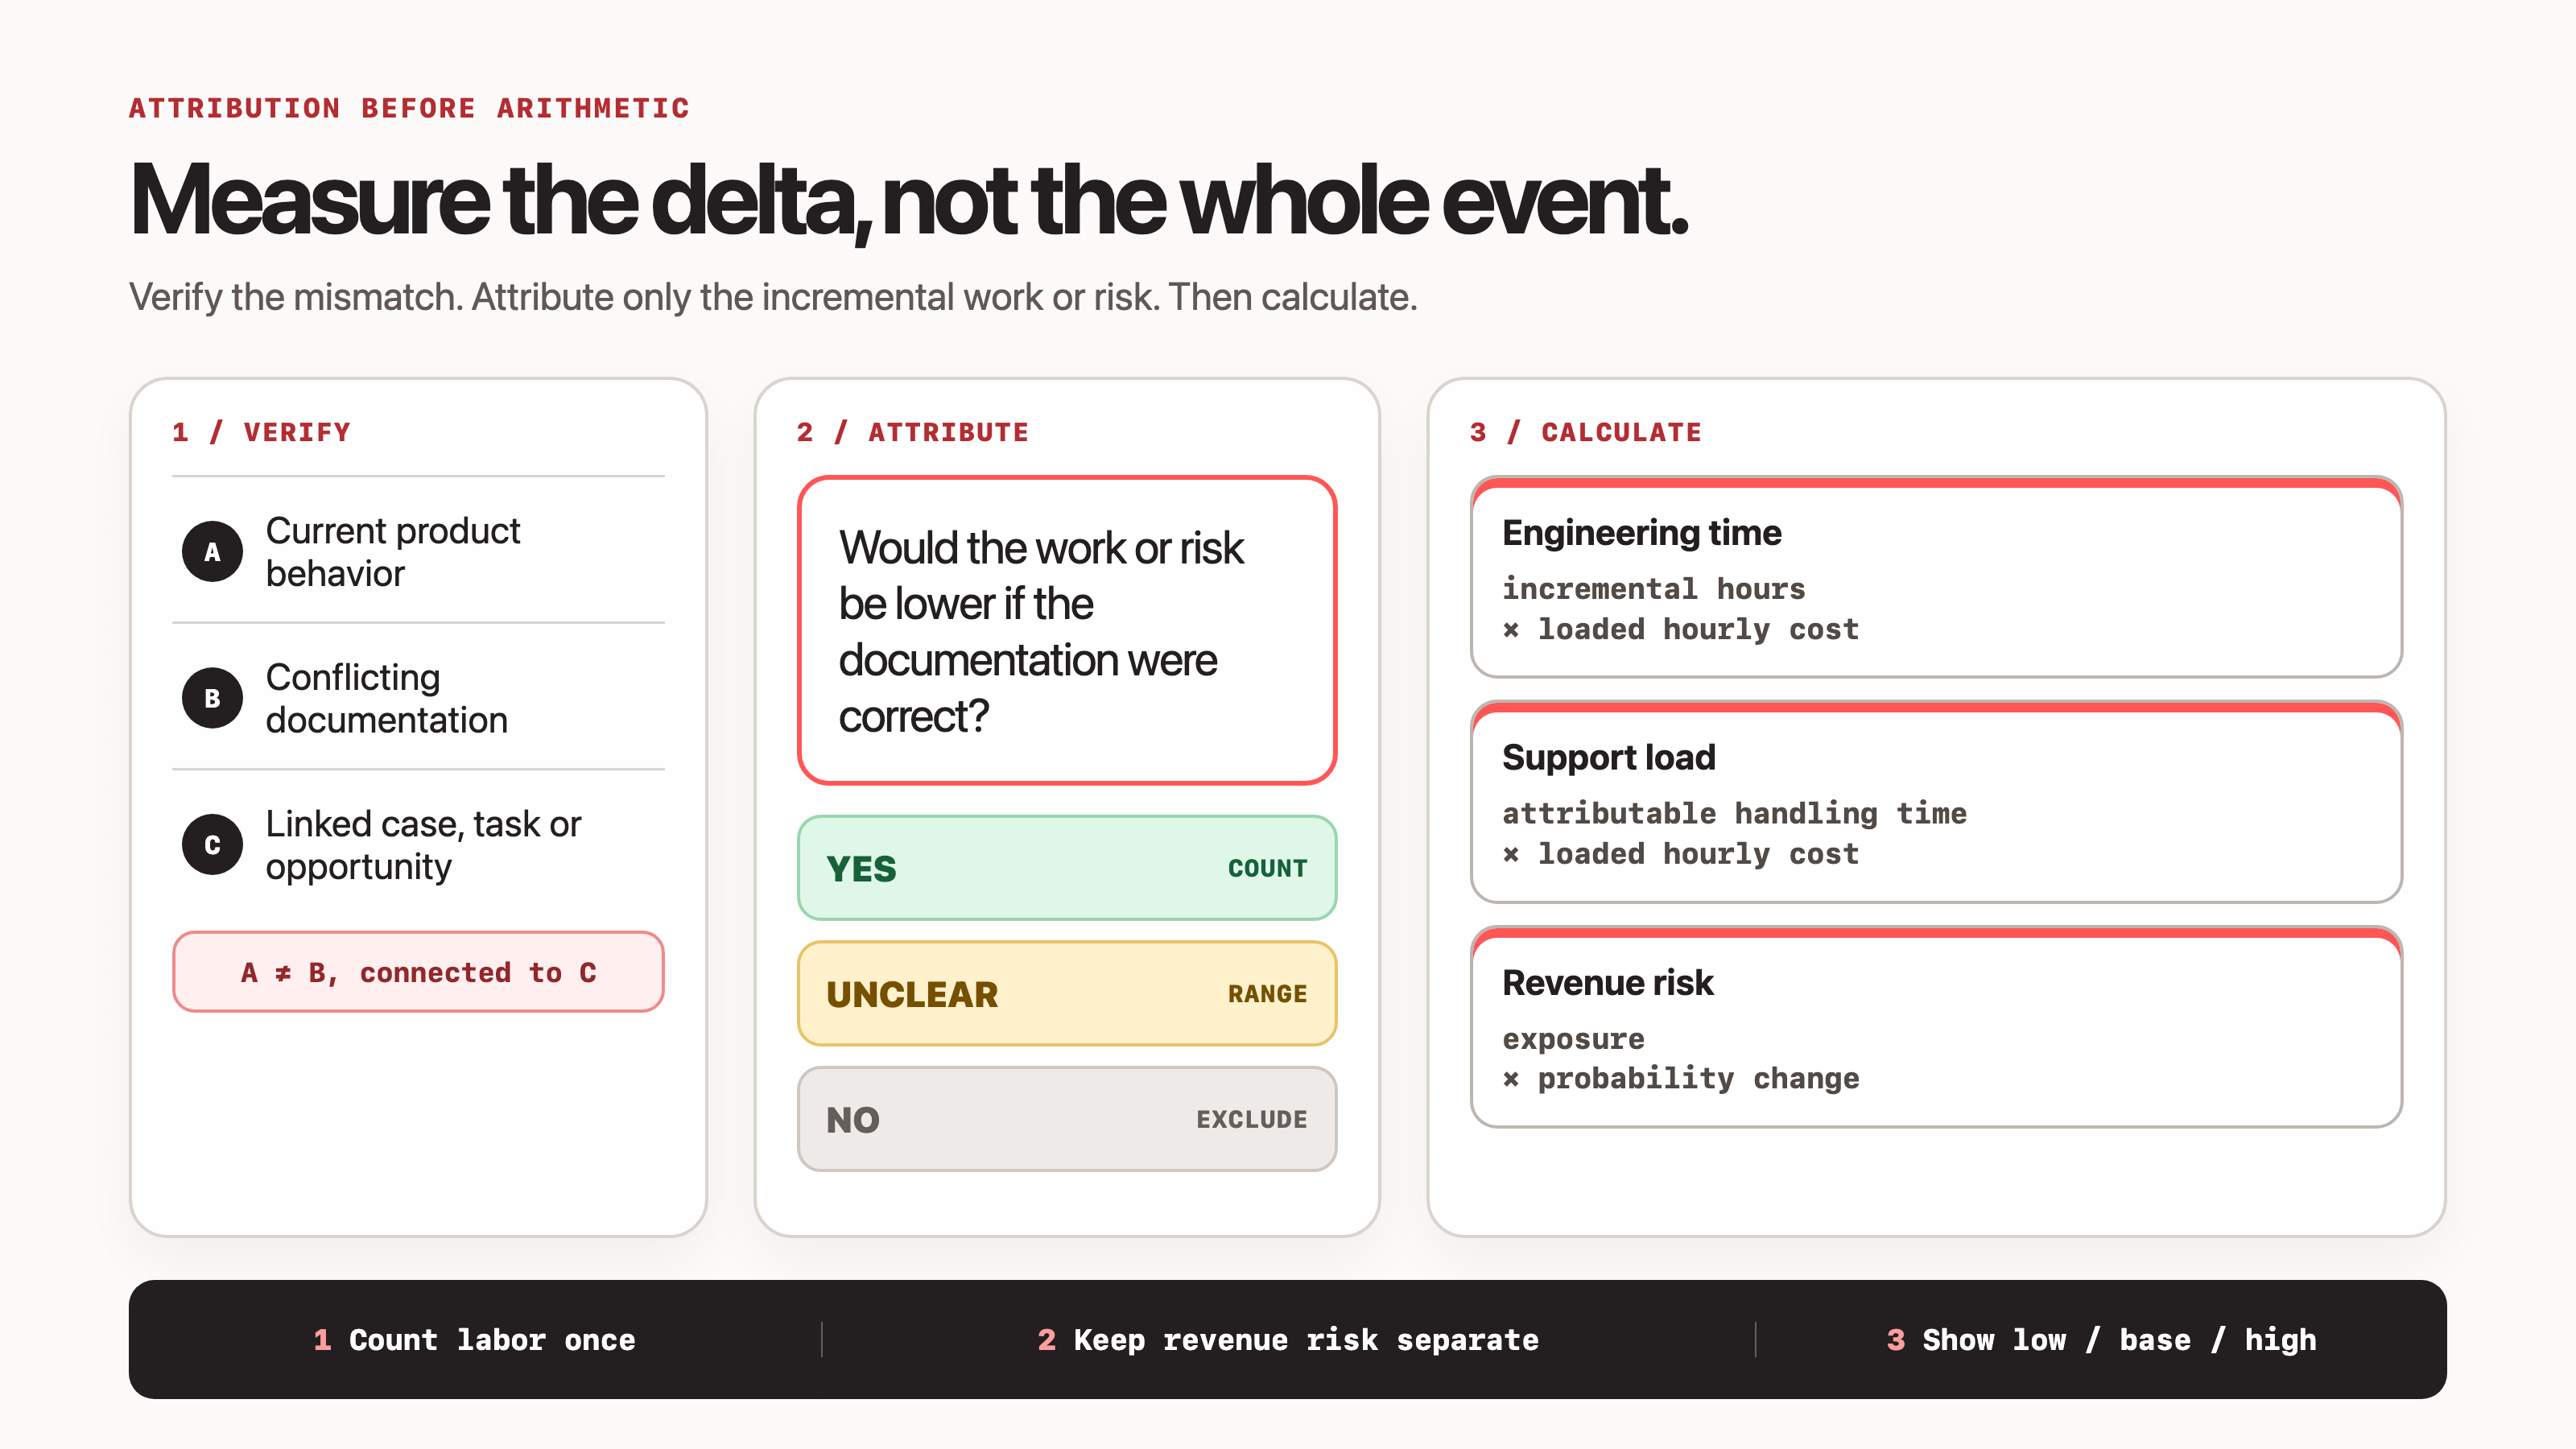
For each case, interruption, task, or opportunity, verify three things:
- Current product behavior.
- The conflicting, missing, or hard-to-find documentation.
- A linked event that created measurable work or risk.
Then ask:
Would this work or risk have been lower if the documentation were correct and findable?
Use one of three treatments:
- Yes: count the incremental effect.
- Unclear: include a low, base, and high range.
- No: exclude the event.
 (opens the full-size image in a new tab)
Label every input
Give each input a provenance label in the worksheet:
| Label | Meaning | Example |
|---|---|---|
| Measured | Directly observed in a source system | Ticket handling minutes |
| Derived | Arithmetic applied to measured inputs | Hours multiplied by a finance-approved rate |
| Assumption | An unmeasured judgment or policy choice | Probable-case attribution weight |
| Extrapolation | A measured sample applied to a larger population | Audit defect rate applied to unaudited pages |
Every assumption should have an owner, rationale, date, low/base/high values, and review date. If nobody can explain where a number came from, keep it out of the model.
Estimate support load
Support cost begins with attributable handling time, not ticket count alone.
Use the event-level formula when ticket data includes time by role:
Support cost
= sum of:
  attribution factor
  × (support hours × support loaded rate
     + customer-success hours × customer-success loaded rate
     + other variable case cost)
For a simpler first pass:
Support cost
= docs-related cases
  × incremental handling minutes per case
  ÷ 60
  × support loaded hourly rate
Separate confirmed and probable cases.
- A confirmed case includes direct evidence that inaccurate, missing, or hard-to-find documentation caused or prolonged the interaction.
- A probable case has a plausible connection but incomplete evidence.
- A general product question does not belong in the model unless better documentation could reasonably have prevented or shortened it.
If support does not track time per case, sample a representative set. Measure handling, follow-up, internal coordination, and escalation time. Apply the sample to the wider population only when the case mix is comparable, and label the result as an extrapolation.
Keep engineering escalations out of the support subtotal
A support agent and an engineer may work on the same ticket. Put each person's time in the cost category that owns it.
Support minutes belong in support cost. Engineer investigation, response, and recovery belong in engineering cost. The case can appear in both datasets, but the same minute cannot.
Estimate engineering time and context switching
Documentation work reaches engineering through several paths:
- Planned authoring or technical review.
- Reactive clarification for support, success, sales engineering, or another developer.
- Investigation to determine whether the docs or the product is wrong.
- Emergency remediation after a release.
- Recovery time before the engineer fully resumes planned work.
Keep planned work separate from interruptions. That distinction helps an engineering leader decide whether the problem is insufficient maintenance capacity or an unpredictable reactive workload.
Use this formula for interruptions:
Engineering interruption cost
= sum of:
  attribution factor
  × (direct interruption hours + recovery hours)
  × engineer loaded hourly rate
Direct time includes investigation, answering, reproducing a failure, explaining current behavior, and making an emergency correction.
Recovery should come from the team's own evidence. Ask a small group to log the end of each docs-related interruption and the first sustained return to the planned task. Exclude scheduled meetings, breaks, and idle time.
Do not import a generic context-switching penalty. Teams, tasks, and interruption types differ too much. When recovery data is incomplete, use:
- Low: zero recovery for missing events.
- Base: the team's median measured recovery for comparable events.
- High: an internally observed upper percentile.
Loaded labor cost also needs a clear definition:
Loaded hourly rate
= finance-approved annual labor cost
  ÷ finance-approved annual productive hours
This converts consumed capacity into a consistent value. It does not prove cash savings. Call it capacity value unless the intervention reduces overtime, contractors, hiring, or another cash expense.
Calculate documentation debt principal
Documentation debt principal is the remaining one-time effort required to bring known documentation back to the agreed standard.
It is a forward estimate. Past support and interruption costs are already spent and should not be added to the current principal.
Documentation debt principal
= sum of remaining:
  product-truth verification
  + drafting or updating
  + example or procedure validation
  + technical and editorial review
  + publishing and post-publish verification
Convert each role's remaining hours with its loaded rate, then add external costs such as contractor work when applicable.
Define the remediation unit carefully. Five pages may share one stale code sample or one deprecated endpoint. If one fix can update all five together, treat them as one root-cause unit rather than five separate projects.
Track principal movement over time:
Closing principal
= opening principal
  + new debt added
  + previously unknown debt discovered
  - principal retired
A rising backlog does not always mean the process deteriorated. A better audit can discover debt that already existed. Report new debt and newly discovered debt separately.
Treat recurring support and interruption cost as debt interest
The debt metaphor becomes useful when it separates the repair backlog from the recurring cost of leaving it open.
Observed documentation-debt interest
= support cost linked to open debt
  + engineering interruption cost linked to open debt
  + other observed workaround cost linked to open debt
Interest is a roll-up. Show either the components or the interest line in a total, never both.
Avoid turning the metaphor into fake financial precision. Documentation debt does not have a standard annual percentage rate. A monthly interest-to-principal ratio can help prioritize the backlog, but annualizing it assumes stable release volume, incident volume, and seasonality.
Forecast the maintenance workload
A team can clear the backlog and recreate it during the next release cycle. Forward maintenance is the normal capacity required to keep new changes aligned with documentation.
Required maintenance hours
= forecast product changes
  × historical doc-impact rate
  × hours per impacted change
  + fixed recurring maintenance hours
Estimate this by change class when the work differs materially. A new endpoint, an SDK method change, a pricing change, and a UI label update do not carry the same documentation effort.
Fixed recurring work may include scheduled audits, link checks, example validation, taxonomy work, and review governance that is not tied to a single change.
Keep maintenance distinct from debt principal:
- Principal repairs documentation already behind the product.
- Maintenance keeps current product changes from creating new debt.
- Reactive support and interruption costs are the recurring interest generated while mismatches remain.
If one task serves two purposes, split its hours or assign it to one primary category. Do not count the full task in both.
Estimate revenue risk without calling it lost revenue
Revenue is the least certain part of the model. Start with what the evidence can support.
Use three levels:
- Confirmed realized impact: refunds, service credits, contract reductions, or committed revenue lost with documented causal evidence.
- Docs-influenced exposure: the value of unique opportunities or accounts with an explicit documentation blocker.
- Expected revenue risk: exposure multiplied by the estimated change in outcome probability attributable to documentation.
For sales-led opportunities:
Expected revenue risk
= sum of:
  unique opportunity value
  × estimated probability change caused by the documentation mismatch
For self-serve acquisition:
Expected self-serve revenue risk
= eligible exposed starts
  × (activation rate after fix - activation rate before fix)
  × paid conversion after activation
  × revenue per new paid account
Use the self-serve formula only when the cohort does not overlap with opportunity-level exposure. Deduplicate accounts that later enter the sales pipeline.
The probability change is usually the weakest input. Prefer a cohort comparison, phased rollout, controlled test, or reviewed postmortem. If the team cannot defend the counterfactual, report docs-influenced exposure and leave expected revenue risk uncalculated.
Use one value basis throughout. Do not mix annual contract value, lifetime value, recognized revenue, and contribution margin in one sum.
A worked example
The figures below are illustrative assumptions. They are not EkLine results, customer results, or industry benchmarks.
A team reviews one month of incidents around an outdated authentication guide.
Support
- 17.5 confirmed support hours.
- 7 hours from probable cases.
- 50% attribution for probable cases in the base scenario.
- $48 support loaded hourly rate.
Base support cost
= (17.5 + 50% × 7) × $48
= $1,008.00
Engineering interruptions
- 8 direct engineering hours.
- 2.25 measured recovery hours.
- 4 interruptions without recovery data.
- 0.25 hours imputed per missing event in the base scenario.
- $105 engineering loaded hourly rate.
Base engineering interruption cost
= (8 + 2.25 + 4 × 0.25) × $105
= $1,181.25
The 30-day observed interest roll-up is:
$1,008.00 + $1,181.25 = $2,189.25Outstanding principal
The team estimates that the known backlog requires:
- 42 documentation hours at $72 per hour.
- 16 engineering review hours at $105 per hour.
- $250 in external cost.
Base documentation debt principal
= 42 × $72 + 16 × $105 + $250
= $4,954
Forward maintenance
The next month includes 50 forecast product changes. The base case assumes:
- 28% will affect documentation.
- Each impacted change needs 2 documentation hours.
- Each impacted change needs 0.4 engineering review hours.
- Fixed recurring documentation work takes 8 hours.
Impacted changes       = 50 × 28% = 14
Documentation hours    = 14 × 2 + 8 = 36
Engineering review     = 14 × 0.4 = 5.6 hours
Total required capacity = 41.6 hours
Revenue risk
Three unique opportunities have first-year values of $120,000, $80,000, and $60,000. CRM notes confirm a documentation blocker, but documentation is not the only decision factor. The team estimates probability changes of 5%, 3%, and 2%.
Base expected revenue risk
= $120,000 × 5%
  + $80,000 × 3%
  + $60,000 × 2%
= $9,600
The executive readout should show:
| Output | Base estimate | Meaning |
|---|---|---|
| 30-day support burden | $1,008.00 | Measured floor plus modeled probable-case attribution |
| 30-day engineering interruption burden | $1,181.25 | Measured time plus imputed missing recovery |
| 30-day recurring interest | $2,189.25 | Roll-up of the two labor categories |
| Outstanding principal | $4,954 | Remaining one-time remediation estimate |
| Next-month maintenance | 41.6 hours | Forward capacity requirement |
| First-year revenue risk | $9,600 | Modeled counterfactual risk |
Do not sum the final three lines. They use different horizons and evidence classes.
Calculate ROI after the intervention
The previous ROI page promised a calculator without providing an interactive tool. This guide uses transparent formulas that a team can audit in a spreadsheet.
Measure ROI after a bounded fix or workflow change:
Realized annual benefit
= baseline annualized operating cost
- post-change annualized operating costROI
= (realized annual benefit - annual program cost)
÷ annual program cost
× 100Payback period in months
= upfront implementation cost
÷ monthly net measured benefitKeep modeled revenue improvement beside the realized operating result unless the revenue change has been observed with a credible comparison. An impressive ROI built from assumed savings and exposed pipeline will not survive finance review.
Build the spreadsheet
A practical workbook needs seven input tabs and one summary:
- Assumptions.
- Loaded rates.
- Support events.
- Engineering interruptions.
- Debt inventory.
- Maintenance forecast.
- Revenue risk.
- Summary.
A minimal event export can start with these columns:
period,event_id,doc_issue_id,event_type,attribution_class,attribution_weight,support_hours,engineering_direct_hours,engineering_recovery_hours,loaded_rate,revenue_exposure,probability_delta,source_url,ownerThe summary should keep observed cost, principal, maintenance capacity, and revenue risk in separate panels. Include low, base, and high scenarios for uncertain inputs. Keep exact inputs, such as approved rates and actual refunds, fixed across scenarios.
Run a 30-day baseline
Days 1 to 3: choose the failure mode
Pick one high-friction journey, such as authentication, an SDK quickstart, webhook setup, or one integration. Define what counts as a documentation mismatch and what evidence qualifies an event for the model.
Days 4 to 10: instrument the work
Add support tags, record engineering escalations, sample recovery time, and link events to the affected page or root cause. Export buyer objections or security-review questions only when they name a documentation gap.
Days 11 to 17: estimate principal and maintenance
Audit the known pages in scope. Group shared root causes. Estimate remaining hours by role. Review recent product changes to calculate the doc-impact rate and likely maintenance workload.
Days 18 to 24: fix one expensive cluster
Choose the cluster with the strongest observed recurring cost and a tractable remediation path. Update the content, validate examples, complete technical review, and record the actual effort.
Days 25 to 30: compare and decide
Measure the same support and engineering signals again. Record what changed, what did not, and which assumptions remain unresolved.
Use this decision rule:
- Scale when observed burden falls and the workflow can support a larger scope.
- Revise when the fix ships but incidents persist or attribution remains unclear.
- Stop when the documentation mismatch was not a material cause of the measured problem.
Prioritize fixes by avoidable cost
Page count is a weak priority signal. Rank root-cause clusters using:
Priority score inputs
= observed recurring cost
  + evidence-backed revenue risk
  + affected-user criticality
  + expected avoidable share
  - remediation effort
Do not hide these inputs inside an unexplained score. A simple decision table is usually clearer.
| Cluster | Observed monthly burden | Revenue evidence | Remediation effort | Decision |
|---|---|---|---|---|
| Outdated authentication flow | High | Activation and buyer notes | Medium | Fix first |
| Old screenshot on a low-use page | Low | None | Low | Batch later |
| Missing enterprise constraint | Medium | Named sales blockers | Low | Fix now |
The best first fix is often the mismatch that creates frequent repeat work and has a clear owner, rather than the oldest page in the inventory.
Where EkLine fits
This cost model tells a team where documentation drift is expensive. It does not detect every product change, draft the correction, or route the update through review.
EkLine's current documentation says Docs Agent can update existing documentation from Jira or Linear tickets and from code changes. It also provides review feedback, shows a diff before a pull request, and can create or update the documentation pull request.
EkLine's GitHub integration can start from a pull-request comment, generate a draft from the prompt and PR context, let the team review and edit it, and open a docs pull request on the configured documentation repository.
The human checkpoint matters. A documentation-cost workflow should reduce repetitive discovery and drafting while keeping product accuracy, audience fit, and publication approval with the team.
EkLine does not replace the cost model, finance approval, support tagging, CRM attribution, or the documentation platform. It fits after the team identifies a recurring mismatch and wants a reviewable way to turn product or support context into a documentation change.
Frequently asked questions
Documentation is outdated when it conflicts with current product behavior or no longer helps the intended reader complete the documented task. Age alone does not establish that a page is outdated.
Measure incremental support handling, engineering interruption and recovery, and other observed workaround costs during a fixed period. Estimate the remaining repair backlog separately, then model revenue risk only where buyer or cohort evidence supports a counterfactual.
Documentation debt is the known remediation obligation created when documentation falls behind the product or the reader's task. Principal is the remaining repair effort. Interest is the recurring support, engineering, and workaround cost generated while the debt remains open.
Track direct interruption time and the team's own recovery time. Use zero, median, and upper-bound recovery values for low, base, and high scenarios when some events are missing data. Avoid a universal recovery multiplier.
Yes, when each role's time appears once and both values cover the same period. If a support case escalates to engineering, keep support minutes in the support subtotal and engineer minutes in the engineering subtotal.
Usually no. Revenue exposure is the value associated with accounts or opportunities that have a documentation blocker. Expected revenue risk requires an additional probability model. Report both separately from observed labor cost.
Use a bounded 30-day window around one product journey. Collect enough events to explain the main support and engineering patterns, then disclose the sample and confidence. The goal is a decision-quality baseline, not false statistical precision.
No. It is a transparent measurement method with formulas and spreadsheet fields. An interactive tool may come later, but the current guide does not promise one.
No. EkLine works in the update and review workflow. Your documentation platform continues to host and publish the content.
Choose one verified mismatch with recurring support or engineering evidence. Measure it for 30 days, fix the root cause, and compare the same signals after the change.
Start with one expensive mismatch
Pick one outdated guide tied to repeated tickets, engineering escalations, or a documented buyer blocker. Run the 30-day baseline. Keep observed cost separate from modeled risk. Then fix the root cause and calculate ROI from the change you can measure.
If the expensive part is turning code, ticket, or pull-request context into a reviewable documentation update, see how EkLine updates and reviews documentation.